
obdiag帮你读懂全链路诊断日志——《OceanBase诊断系列》之六
OceanBase 数据库是一款分布式数据库,所以其调用链路相对复杂。当遇到超时问题时,运维人员往往难以迅速确定是OceanBase内部组件的问题还是网络问题。他们通常只能依赖经验和observer日志来进行分析。然而,随着OceanBase 4.0版本的推出,OB内核新增了trace.log日志功能,这为全链路诊断提供了有力的
作者简介:靖顺,OcenaBase 开发工程师,专注于数据库诊断与调优
1. 前言
OceanBase 数据库是一款分布式数据库,其调用链路相对复杂,因此遇到超时问题时,运维人员有时难以迅速确定是OceanBase内部组件的问题还是网络问题。通常只能依赖运维经验和observer日志来进行分析。随着OceanBase 4.0版本的推出,OB内核新增了trace.log日志功能,这为全链路诊断提供了有力的工具。
全链路诊断涉及两条路径:
第一条路径是应用通过客户端(如JDBC或OCI等)发送请求给ODP(代理服务器),然后ODP再访问OBServer以获取数据,最后将访问结果返回给应用。
第二条路径是应用通过客户端直接访问OBServer,将结果返回给应用。
全链路诊断旨在通过对这两条路径上所有组件的细致分析,精确定位问题所在。

Trace 文件会独立记录到 OBProxy 和 OBServer 不同进程所在机器,考虑到数据库客户端使用是在业务服务端,OceanBase 数据库 OBClient 端的全链路 Trace 信息并没有记录到业务服务器上,而是传输到 OBProxy 记录。
用户可以通过客户端访问 OceanBase 数据库,客户端的请求经由 OBProxy 分发到 OBServer 或直接访问 OBServer,在此过程中,运维人员可根据运维需要,通过使用 PL/SQL 程序包 DBMS_MONITOR 中相关方法,控制相关应用程序根据不同标识信息维度判断是否开启全链路诊断 trace,以及该 trace 的相关信息打印到 trace 日志。trace 日志会根据访问路径的情况判断日志打印,经由 ODP 访问数据库的,则会记录相关日志到 OBProxy 和 OBServer 对应的日志文件中;直接访问 OBServer ,则仅记录日志到 OBServer 对应的日志文件中。OBProxy 的 trace 日志文件为 obproxy_trace.log, OBServer 的 trace 日志文件为 trace.log。 trace 日志文件每个大小为 256M,日志写满 256M 后,会开始写新的 trace.log,之前的文件会被归档,归档的文件数量由相关归档参数控制,超出部分会被删除。运维人员通过对所有 trace 日志进行搜集分析后,可以追踪每个事务或每个 SQL 在整条链路中的执行耗时等相关信息,以此帮助运维人员定位整条访问链路的问题所在。
分布在各个节点上的trace.log怎么才能更友好的分析便是obdiag analyze flt_trace能帮你做的事情。
2. obdiag 全链路诊断设计
2.1 全链路诊断处理流程
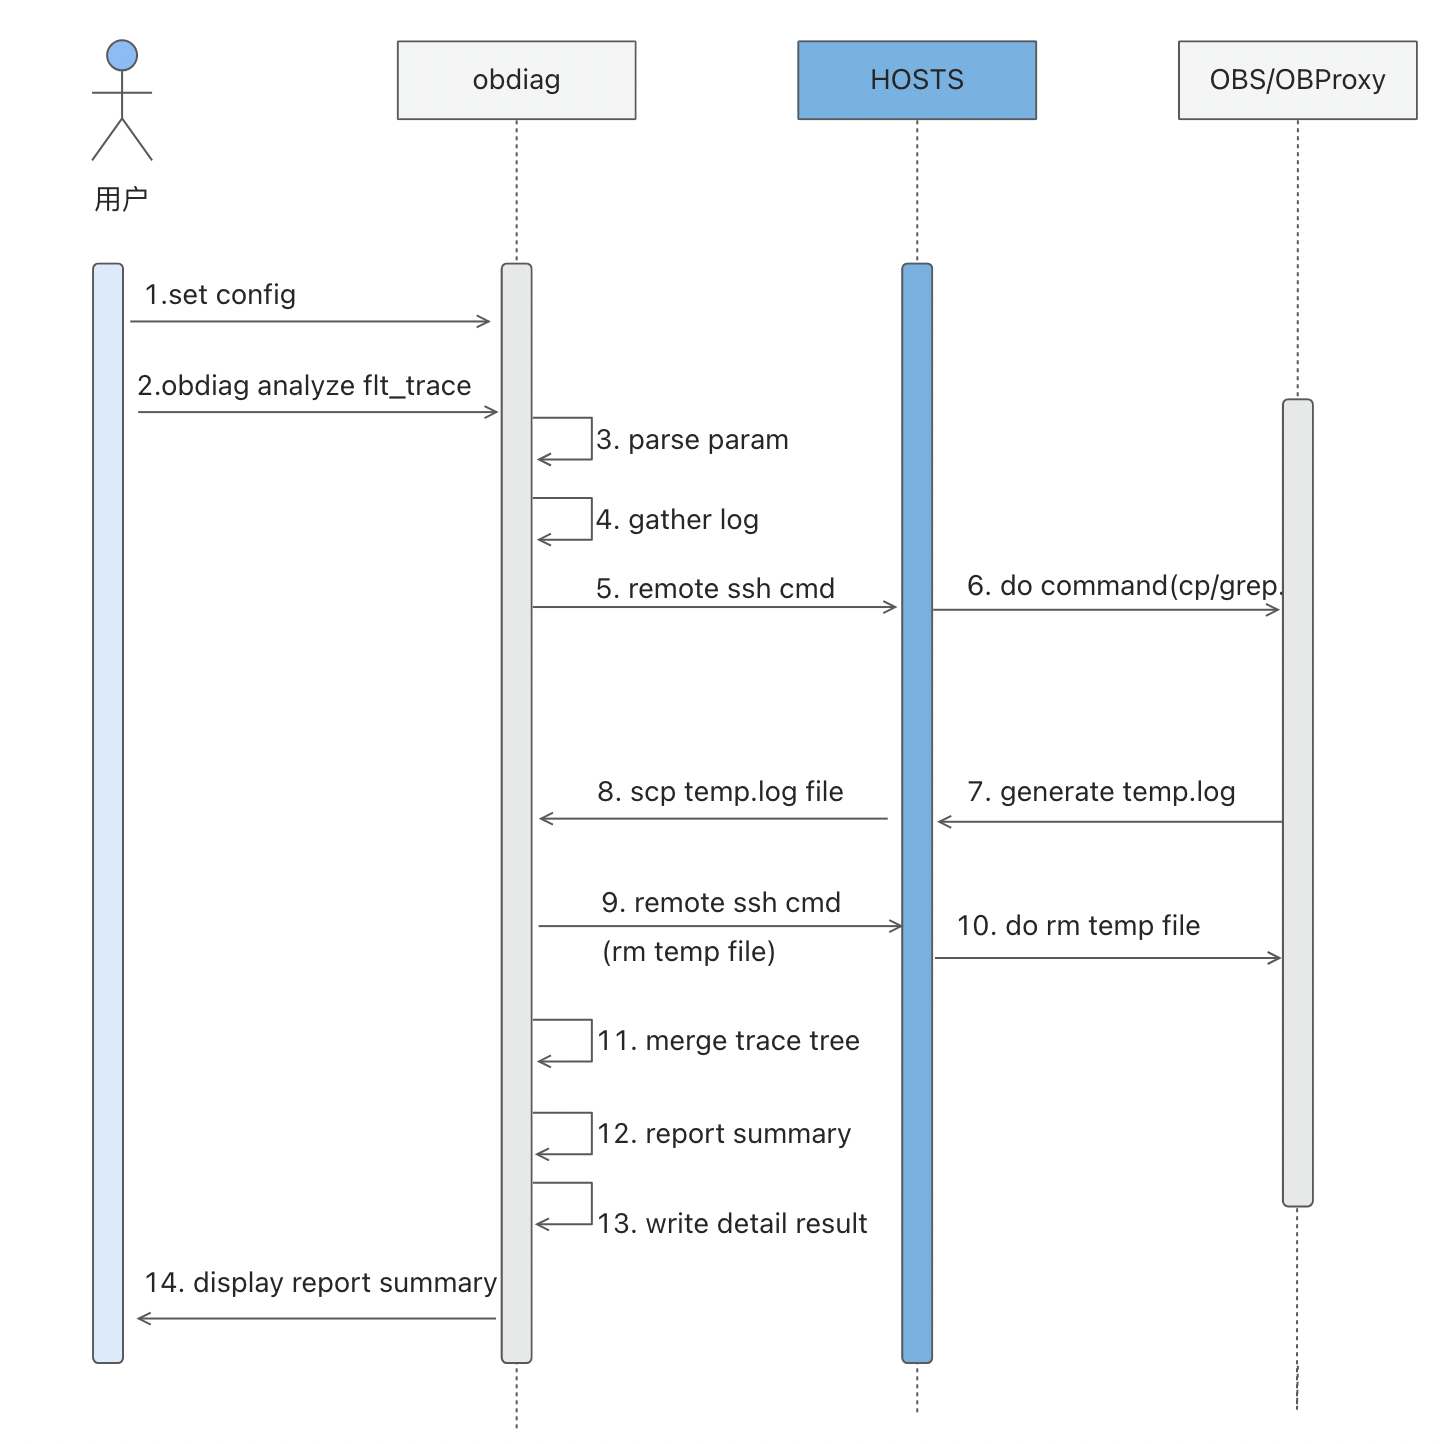
主体架构还是依托于obdiag的集中式采集模式,当用户发起obdiag 的全链路诊断的时候需要去各个节点上进行trace.log的采集,将采集回来的数据集中进行分析处理。
┌────────┐       ┌─────────────────────────────┐       ┌────────────────────────────┐
│ 服务器1 │------>│ 搜索并过滤flt_trace_id相关日志 │------>│ 回传过滤后的日志到obdiag的节点 │---┐
└────────┘       └─────────────────────────────┘       └────────────────────────────┘   │
┌────────┐       ┌─────────────────────────────┐       ┌────────────────────────────┐   │    ┌────────────────────────────────┐
│ 服务器2 │------>│ 搜索并过滤flt_trace_id相关日志 │------>│ 回传过滤后的日志到obdiag的节点 │---┼--->│ 按照父子关系聚合各节点日志输出链路树 │
└────────┘       └─────────────────────────────┘       └────────────────────────────┘   │    └────────────────────────────────┘
┌────────┐       ┌─────────────────────────────┐       ┌────────────────────────────┐   │
│ 服务器N │------>│ 搜索并过滤flt_trace_id相关日志 │------>│ 回传过滤后的日志到obdiag的节点 │---┘
└────────┘       └─────────────────────────────┘       └────────────────────────────┘
2.2 全链路诊断时序图
3. obdiag全链路诊断实践
各组件支持全链路追踪功能的版本:OB-Server >= 4.0.0.0,OB-Proxy >=4.0.0,OB-JDBC >=2.4.0。obdiag >= 1.5.0。
Step 1: 查找疑似慢的sql
在gv$ob_sql_audit中,如果有明确的SQL语句可以通过通过query_sql查到疑似慢sql的 flt_trace_id, 例如:
OceanBase(root@test)>select query_sql, flt_trace_id from oceanbase.gv$ob_sql_audit where query_sql like 'select @@version_comment limit 1';
+----------------------------------+--------------------------------------+
| query_sql                        | flt_trace_id                         |
+----------------------------------+--------------------------------------+
| select @@version_comment limit 1 | 00060aa3-d607-f5f2-328b-388e17f687cb |
+----------------------------------+--------------------------------------+
1 row in set (0.001 sec)
其中flt_trace_id为00060aa3-d607-f5f2-328b-388e17f687cb.
或者你也可从obproxy、oceanbase的trace.log日志中找到flt_trace_id
head trace.log

[2023-12-07 22:20:07.242229] [489640][T1_L0_G0][T1][YF2A0BA2DA7E-00060BEC28627BEF-0-0] {"trace_id":"00060bec-275e-9832-e730-7c129f2182ac","name":"close_das_task","id":"00060bec-2a20-bf9e-56c9-724cb467f859","start_ts":1701958807240606,"end_ts":1701958807240607,"parent_id":"00060bec-2a20-bb5f-e03a-5da01aa3308b","is_follow":false}
其中 00060bec-275e-9832-e730-7c129f2182ac 就是其flt_trace_id。
Step 2: 设置配置文件
参考链接
Step 3: 执行全链路诊断命令
obdiag analyze flt_trace [options]选项说明如下:
| 选项名 | 是否必选 | 数据类型 | 默认值 | 说明 |
|---|---|---|---|---|
| --flt_trace_id | 是 | string | flt_trace_id | flt_trace_id从gv$ob_sql_audit中查看flt_trace_id或者直接通过trace.log查找 |
| --store_dir | 否 | string | 默认为命令执行的当前路径 | 存储结果的本地路径。 |
| --files | 否 | string | 默认为空 | --files是离线分析日志文件模式,一旦指定 --files则进入离线分析日志模式 |
| --top | 否 | string | 5 | 展示在全链路诊断结果中耗时最长的Top N叶子节点 |
| --recursion | 否 | string | 8 | 最大递归的全链路诊断的层数 |
| --output | 否 | string | 60 | 打印到屏幕上的结果行数,全量结果会完整的存储到结果文件中 |
| -c | 否 | string | ~/.obdiag/config.yml | 配置文件路径 |
样例:
obdiag analyze flt_trace --flt_trace_id 000605b1-28bb-c15f-8ba0-1206bcc08aa3

root node id: 000605b1-28bb-c15f-8ba0-1206bcc08aa3

TOP time-consuming leaf span:
+---+----------------------------------+-------------+---------------------+
| ID| Span Name                        | Elapsed Time|      NODE           |
+---+----------------------------------+-------------+---------------------+
| 18| px_task                          | 2.758 ms    | OBSERVER(xx.xx.xx.1)|
| 5 | pc_get_plan                      | 52 μs       | OBSERVER(xx.xx.xx.1)|
| 16| do_local_das_task                | 45 μs       | OBSERVER(xx.xx.xx.1)|
| 10| do_local_das_task                | 17 μs       | OBSERVER(xx.xx.xx.1)|
| 17| close_das_task                   | 14 μs       | OBSERVER(xx.xx.xx.1)|
+---+----------------------------------+-------------+---------------------+
Tags & Logs:
-------------------------------------
18 - px_task  Elapsed: 2.758 ms
     NODE:OBSERVER(xx.xx.xx.1)
     tags: [{'group_id': 0}, {'qc_id': 1}, {'sqc_id': 0}, {'dfo_id': 1}, {'task_id': 1}]
5 - pc_get_plan  Elapsed: 52 μs
    NODE:OBSERVER(xx.xx.xx.1)
16 - do_local_das_task  Elapsed: 45 μs
     NODE:OBSERVER(xx.xx.xx.3)
10 - do_local_das_task  Elapsed: 17 μs
     NODE:OBSERVER(xx.xx.xx.1)
17 - close_das_task  Elapsed: 14 μs
     NODE:OBSERVER(xx.xx.xx.3)

Details:
+---+----------------------------------+-------------+---------------------+
| ID| Span Name                        | Elapsed Time|  NODE               |
+---+----------------------------------+-------------+---------------------+
| 1 | TRACE                            | -           | -                   |
| 2 | └─com_query_process              | 5.351 ms    | OBPROXY(xx.xx.xx.1) |
| 3 |   └─mpquery_single_stmt          | 5.333 ms    | OBSERVER(xx.xx.xx.1)|
| 4 |     ├─sql_compile                | 107 μs      | OBSERVER(xx.xx.xx.1)|
| 5 |     │ └─pc_get_plan              | 52 μs       | OBSERVER(xx.xx.xx.1)|
| 6 |     └─sql_execute                | 5.147 ms    | OBSERVER(xx.xx.xx.1)|
| 7 |       ├─open                     | 87 μs       | OBSERVER(xx.xx.xx.1)|
| 8 |       ├─response_result          | 4.945 ms    | OBSERVER(xx.xx.xx.1)|
| 9 |       │ ├─px_schedule            | 2.465 ms    | OBSERVER(xx.xx.xx.1)|
| 10|       │ │ ├─do_local_das_task    | 17 μs       | OBSERVER(xx.xx.xx.1)|
| 11|       │ │ ├─px_task              | 2.339 ms    | OBSERVER(xx.xx.xx.2)|
| 12|       │ │ │ ├─do_local_das_task  | 54 μs       | OBSERVER(xx.xx.xx.2)|
| 13|       │ │ │ └─close_das_task     | 22 μs       | OBSERVER(xx.xx.xx.2)|
| 14|       │ │ ├─do_local_das_task    | 11 μs       | OBSERVER(xx.xx.xx.1)|
| 15|       │ │ ├─px_task              | 2.834 ms    | OBSERVER(xx.xx.xx.3)|
| 16|       │ │ │ ├─do_local_das_task  | 45 μs       | OBSERVER(xx.xx.xx.3)|
| 17|       │ │ │ └─close_das_task     | 14 μs       | OBSERVER(xx.xx.xx.3)|
| 18|       │ │ └─px_task              | 2.758 ms    | OBSERVER(xx.xx.xx.1)|
| 19|       │ ├─px_schedule            | 1 μs        | OBSERVER(xx.xx.xx.1)|
| 20|       │ └─px_schedule            | 1 μs        | OBSERVER(xx.xx.xx.1)|
| ..|       ......                     | ...         |  ......             |
+---+----------------------------------+-------------+---------------------+

For more details, please run cmd ' cat analyze_flt_result/000605b1-28bb-c15f-8ba0-1206bcc08aa3.txt '
查看详情:
cat analyze_flt_result/000605b1-28bb-c15f-8ba0-1206bcc08aa3.txt

root node id: 000605b1-28bb-c15f-8ba0-1206bcc08aa3

TOP time-consuming leaf span:
+---+----------------------------------+-------------+---------------------+
| ID| Span Name                        | Elapsed Time|      NODE           |
+---+----------------------------------+-------------+---------------------+
| 18| px_task                          | 2.758 ms    | OBSERVER(xx.xx.xx.1)|
| 5 | pc_get_plan                      | 52 μs       | OBSERVER(xx.xx.xx.1)|
| 16| do_local_das_task                | 45 μs       | OBSERVER(xx.xx.xx.1)|
| 10| do_local_das_task                | 17 μs       | OBSERVER(xx.xx.xx.1)|
| 17| close_das_task                   | 14 μs       | OBSERVER(xx.xx.xx.1)|
+---+----------------------------------+-------------+---------------------+
Tags & Logs:
-------------------------------------
18 - px_task  Elapsed: 2.758 ms
     NODE:OBSERVER(xx.xx.xx.1)
     tags: [{'group_id': 0}, {'qc_id': 1}, {'sqc_id': 0}, {'dfo_id': 1}, {'task_id': 1}]
5 - pc_get_plan  Elapsed: 52 μs
    NODE:OBSERVER(xx.xx.xx.1)
16 - do_local_das_task  Elapsed: 45 μs
     NODE:OBSERVER(xx.xx.xx.3)
10 - do_local_das_task  Elapsed: 17 μs
     NODE:OBSERVER(xx.xx.xx.1)
17 - close_das_task  Elapsed: 14 μs
     NODE:OBSERVER(xx.xx.xx.3)


Details:

+---+----------------------------------+-------------+---------------------+
| ID| Span Name                        | Elapsed Time|  NODE               |
+---+----------------------------------+-------------+---------------------+
| 1 | TRACE                            | -           | -                   |
| 2 | └─com_query_process              | 5.351 ms    | OBPROXY(xx.xx.xx.1) |
| 3 |   └─mpquery_single_stmt          | 5.333 ms    | OBSERVER(xx.xx.xx.1)|
| 4 |     ├─sql_compile                | 107 μs      | OBSERVER(xx.xx.xx.1)|
| 5 |     │ └─pc_get_plan              | 52 μs       | OBSERVER(xx.xx.xx.1)|
| 6 |     └─sql_execute                | 5.147 ms    | OBSERVER(xx.xx.xx.1)|
| 7 |       ├─open                     | 87 μs       | OBSERVER(xx.xx.xx.1)|
| 8 |       ├─response_result          | 4.945 ms    | OBSERVER(xx.xx.xx.1)|
| 9 |       │ ├─px_schedule            | 2.465 ms    | OBSERVER(xx.xx.xx.1)|
| 10|       │ │ ├─do_local_das_task    | 17 μs       | OBSERVER(xx.xx.xx.1)|
| 11|       │ │ ├─px_task              | 2.339 ms    | OBSERVER(xx.xx.xx.2)|
| 12|       │ │ │ ├─do_local_das_task  | 54 μs       | OBSERVER(xx.xx.xx.2)|
| 13|       │ │ │ └─close_das_task     | 22 μs       | OBSERVER(xx.xx.xx.2)|
| 14|       │ │ ├─do_local_das_task    | 11 μs       | OBSERVER(xx.xx.xx.1)|
| 15|       │ │ ├─px_task              | 2.834 ms    | OBSERVER(xx.xx.xx.3)|
| 16|       │ │ │ ├─do_local_das_task  | 45 μs       | OBSERVER(xx.xx.xx.3)|
| 17|       │ │ │ └─close_das_task     | 14 μs       | OBSERVER(xx.xx.xx.3)|
| 18|       │ │ └─px_task              | 2.758 ms    | OBSERVER(xx.xx.xx.1)|
| 19|       │ ├─px_schedule            | 1 μs        | OBSERVER(xx.xx.xx.1)|
| 20|       │ └─px_schedule            | 1 μs        | OBSERVER(xx.xx.xx.1)|
| 21|       └─close                    | 70 μs       | OBSERVER(xx.xx.xx.1)|
| 22|         └─end_transaction        | 3 μs        | OBSERVER(xx.xx.xx.1)|
+---+----------------------------------+-------------+---------------------+
Tags & Logs:
-------------------------------------
1 -
2 - com_query_process  Elapsed: 5.351 ms
    NODE:OBPROXY(xx.xx.xx.1)
    tags: [{'sess_id': 3221487633}, {'action_name': ''}, {'module_name': ''}, {'client_info': ''}, {'receive_ts': 1695108311007659}, {'log_trace_id': 'YA9257F000001-000605B0441954BC-0-0'}]
3 - mpquery_single_stmt  Elapsed: 5.333 ms
    NODE:OBSERVER(xx.xx.xx.1)
4 - sql_compile  Elapsed: 107 μs
    NODE:OBSERVER(xx.xx.xx.1)
    tags: [{'sql_text': 'select /*+parallel(2)*/ count(1) from t1 tt1, t1 tt2'}, {'sql_id': '797B7202BA69D4C2C77C12BFADDC19DC'}, {'database_id': 201001}, {'plan_hash': 150629045171310866}, {'hit_plan': True}]
5 - pc_get_plan  Elapsed: 52 μs
    NODE:OBSERVER(xx.xx.xx.1)
6 - sql_execute  Elapsed: 5.147 ms
    NODE:OBSERVER(xx.xx.xx.1)
7 - open  Elapsed: 87 μs
    NODE:OBSERVER(xx.xx.xx.1)
8 - response_result  Elapsed: 4.945 ms
    NODE:OBSERVER(xx.xx.xx.1)
9 - px_schedule  Elapsed: 2.465 ms
    NODE:OBSERVER(xx.xx.xx.1)
    tags: [{'used_worker_cnt': 0}, {'qc_id': 1}, {'dfo_id': 2147483647}, {'used_worker_cnt': 0}, {'qc_id': 1}, {'dfo_id': 1}]
10 - do_local_das_task  Elapsed: 17 μs
     NODE:OBSERVER(xx.xx.xx.1)
11 - px_task  Elapsed: 2.339 ms
     NODE:OBSERVER(xx.xx.xx.2)
     tags: [{'group_id': 0}, {'qc_id': 1}, {'sqc_id': 0}, {'dfo_id': 0}, {'task_id': 0}]
12 - do_local_das_task  Elapsed: 54 μs
     NODE:OBSERVER(xx.xx.xx.2)
13 - close_das_task  Elapsed: 22 μs
     NODE:OBSERVER(xx.xx.xx.2)
14 - do_local_das_task  Elapsed: 11 μs
     NODE:OBSERVER(xx.xx.xx.1)
15 - px_task  Elapsed: 2.834 ms
     NODE:OBSERVER(xx.xx.xx.3)
     tags: [{'group_id': 0}, {'qc_id': 1}, {'sqc_id': 0}, {'dfo_id': 1}, {'task_id': 0}]
16 - do_local_das_task  Elapsed: 45 μs
     NODE:OBSERVER(xx.xx.xx.3)
17 - close_das_task  Elapsed: 14 μs
     NODE:OBSERVER(xx.xx.xx.3)
18 - px_task  Elapsed: 2.758 ms
     NODE:OBSERVER(xx.xx.xx.1)
     tags: [{'group_id': 0}, {'qc_id': 1}, {'sqc_id': 0}, {'dfo_id': 1}, {'task_id': 1}]
19 - px_schedule  Elapsed: 1 μs
     NODE:OBSERVER(xx.xx.xx.1)
20 - px_schedule  Elapsed: 1 μs
     NODE:OBSERVER(xx.xx.xx.1)
21 - close  Elapsed: 70 μs
     NODE:OBSERVER(xx.xx.xx.1)
22 - end_transaction  Elapsed: 3 μs
     NODE:OBSERVER(xx.xx.xx.1)
     tags: [{'trans_id': 0}]
4. 附录
- obdiag 官方文档: OceanBase分布式数据库-海量数据 笔笔算数
- obdiag github地址: GitHub - oceanbase/oceanbase-diagnostic-tool: OceanBase Diagnostic Tool is designed to help OceanBase users quickly gather necessary information and analyze the cause of the problem.
| 第一篇 | 如何修炼成“神医”——《OceanBase诊断系列》之一 |
| 第二篇 | 走进SQL审计视图——《OceanBase诊断系列》之二 |
| 第三篇 | 快速收集诊断信息,敏捷诊断工具obdiag应用实践——《OceanBase诊断系列》之三 |
| 第四篇 | 如何快速分析OB集群日志,敏捷诊断工具obdiag分析能力实践——《OceanBase诊断系列》之四 |
| 第五篇 | 防患未然,OceanBase巡检工具应用实践——《OceanBase诊断系列》之五 |
| 第六篇 | obdiag帮你读懂全链路诊断日志——《OceanBase诊断系列》之六 |

了解最新的技术洞察和前沿趋势,参与 OceanBase 定期举办的线下活动,与行业开发者互动交流
更多推荐


 11
11 0
0- 0


 已为社区贡献476条内容

所有评论(0)